Blog
5 Manufacturing Dashboard Examples for Production, OEE & Quality
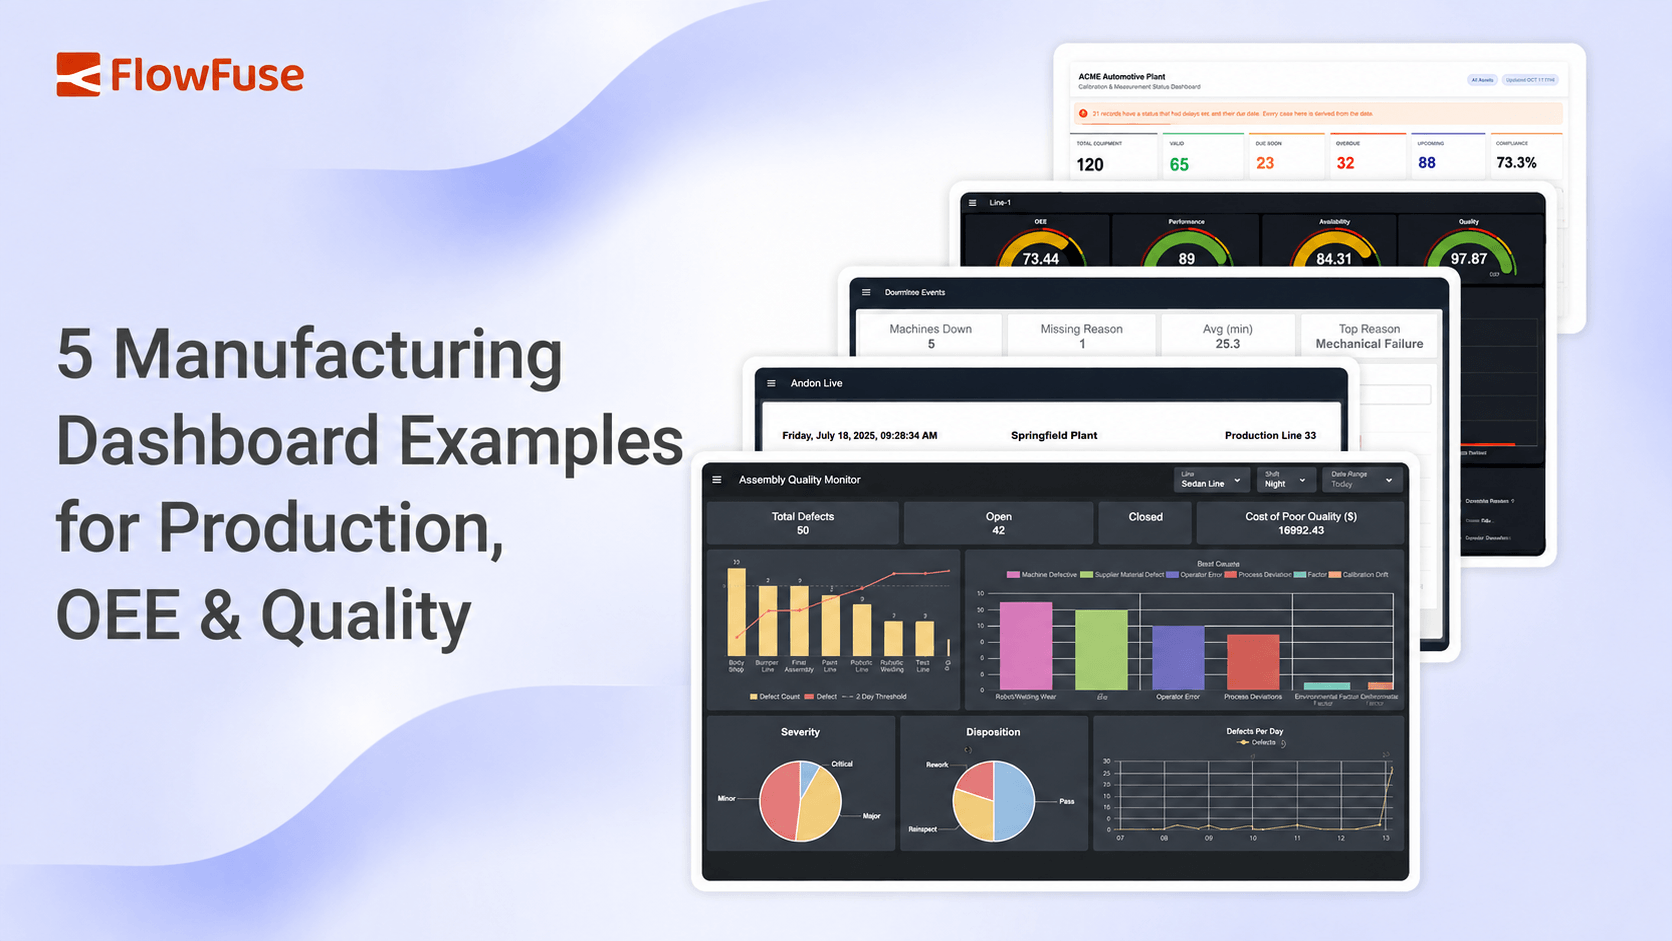
Learn what makes an effective manufacturing dashboard and see five examples for tracking production performance, equipment efficiency, downtime, and quality.
read more...Sign up for our monthly email updates:
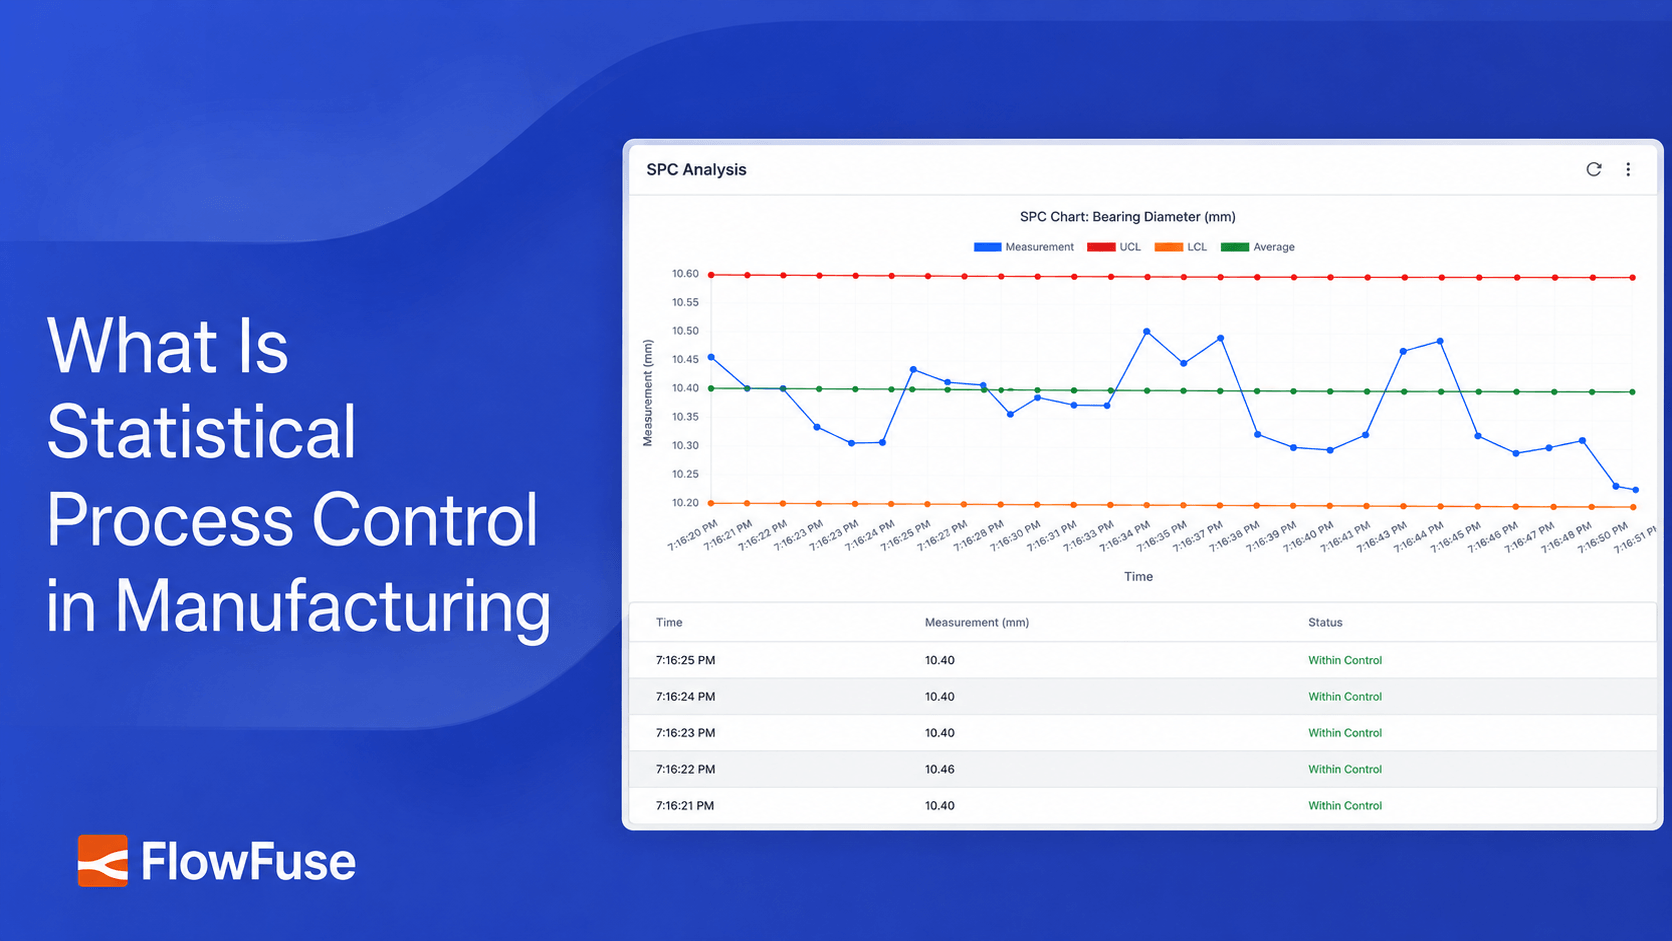
What Is Statistical Process Control in Manufacturing
Statistical process control explained: how SPC charts work, how they apply in the manufacturing space, and what to look for in SPC software.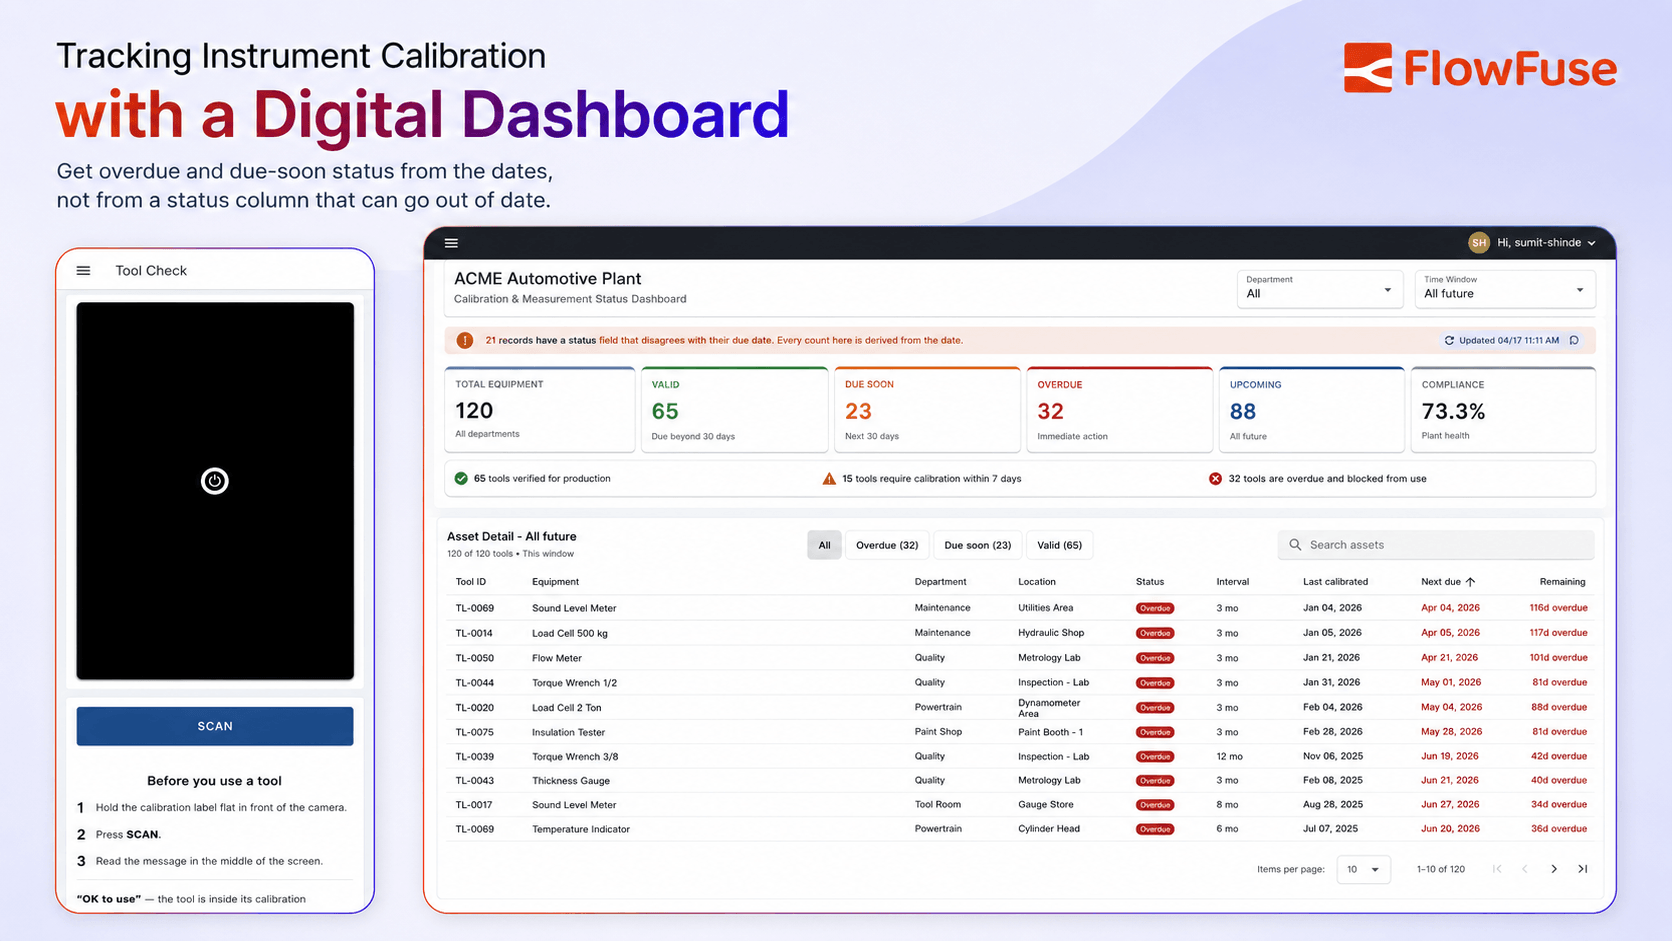
Tracking Instrument Calibration with a Digital Dashboard
Build a calibration status dashboard in FlowFuse: work out overdue, due-soon and compliance figures from due dates, filter by department and time window, and let operators check a tool at the station with a camera.
What Is Instrument Calibration (Equipment Calibration)?
Learn what instrument calibration is, how it differs from verification and adjustment, what a calibration record should contain, how intervals are set, and how manufacturers can manage calibration status more effectively.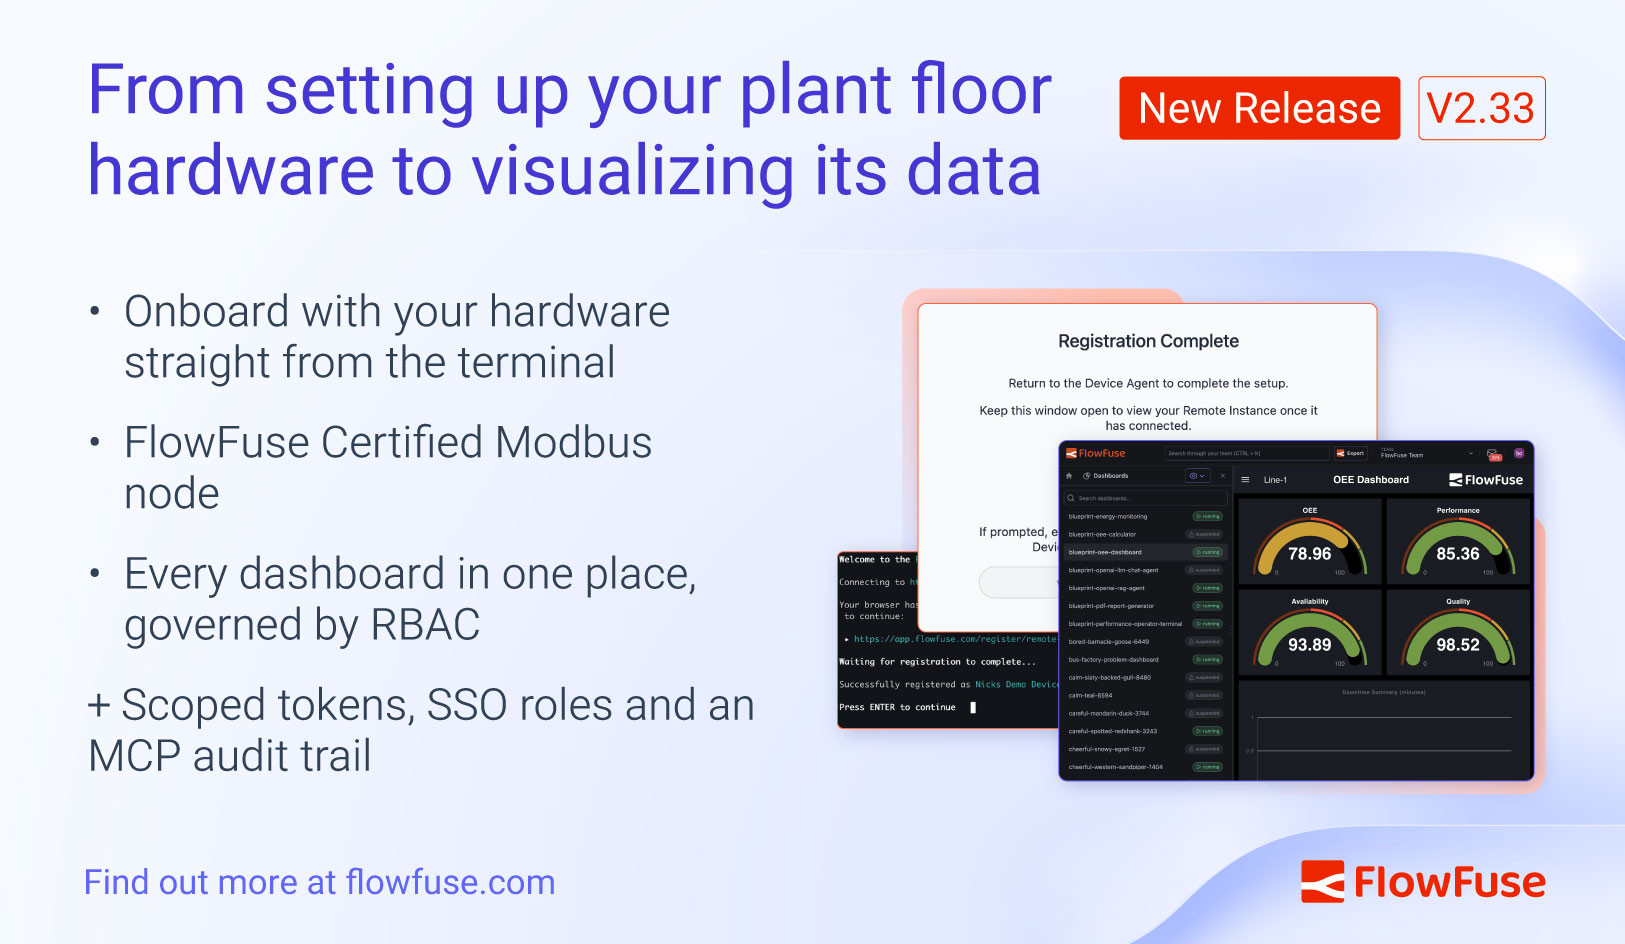
FlowFuse 2.33: From Setting Up Plant Floor Hardware to Visualizing Your Data
FlowFuse 2.33 takes you from setting up plant floor hardware directly to visualizing its data, with a FlowFuse-certified Modbus connection, a home for every dashboard, and firmer control over platform access through scoped Personal Access Tokens, SSO-driven application roles, and an MCP audit trail.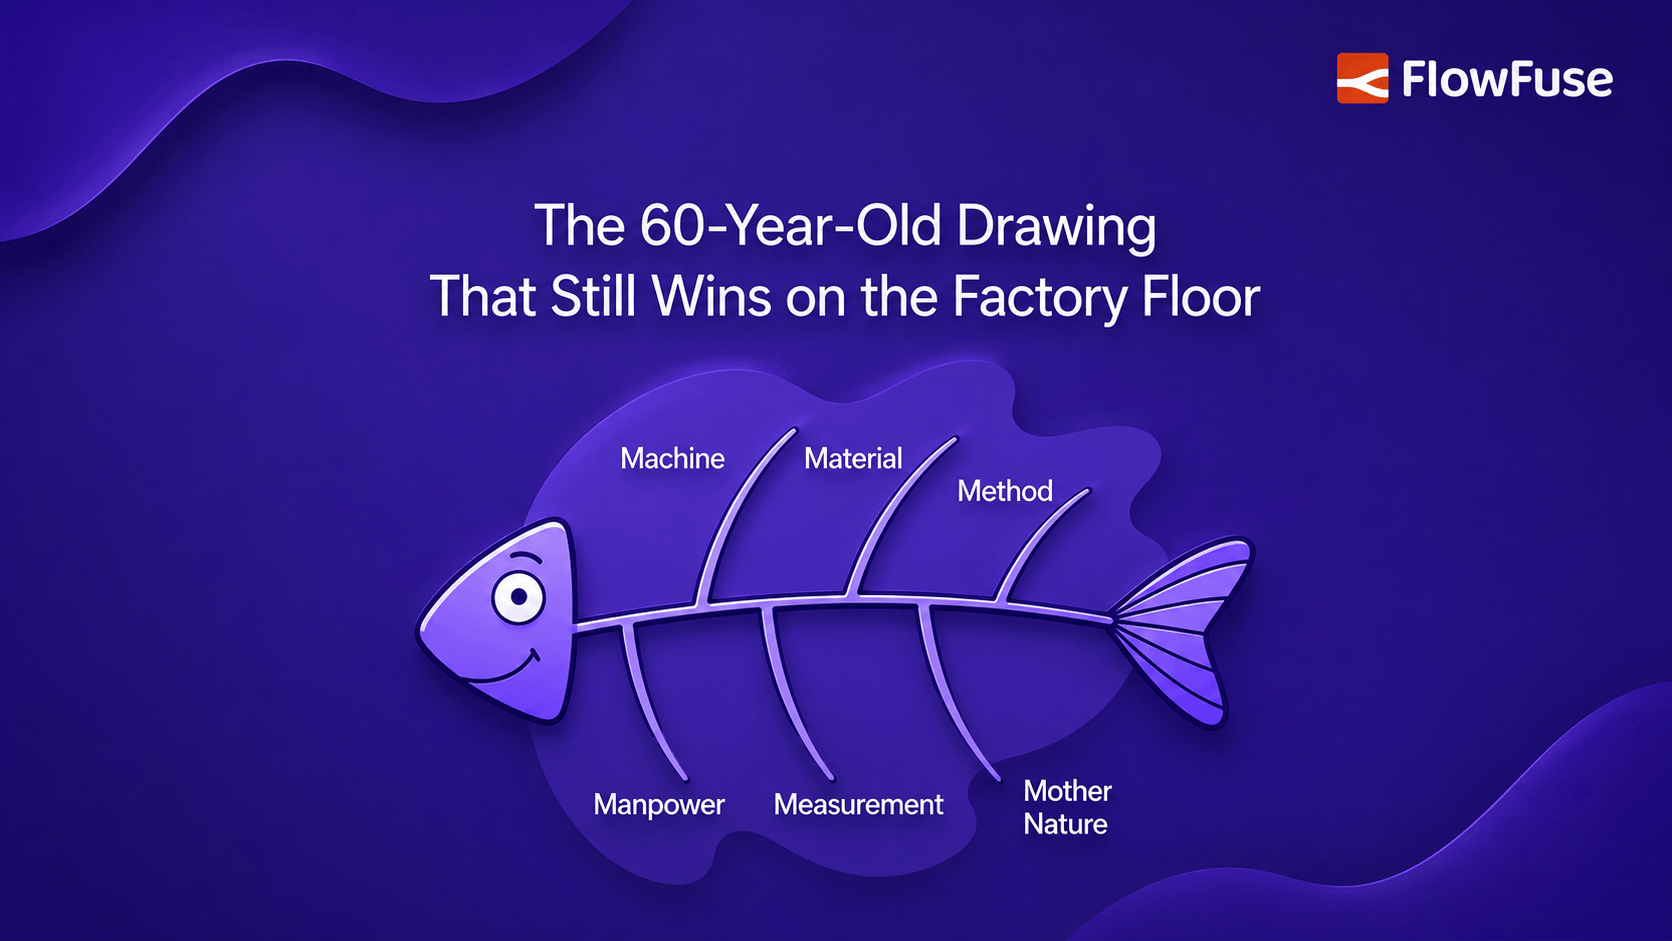
Ishikawa Fishbone Diagram: 6M, Manufacturing Example & Template
Learn what an Ishikawa (fishbone) diagram is, the 6Ms, and how to use it for root cause analysis in manufacturing settings.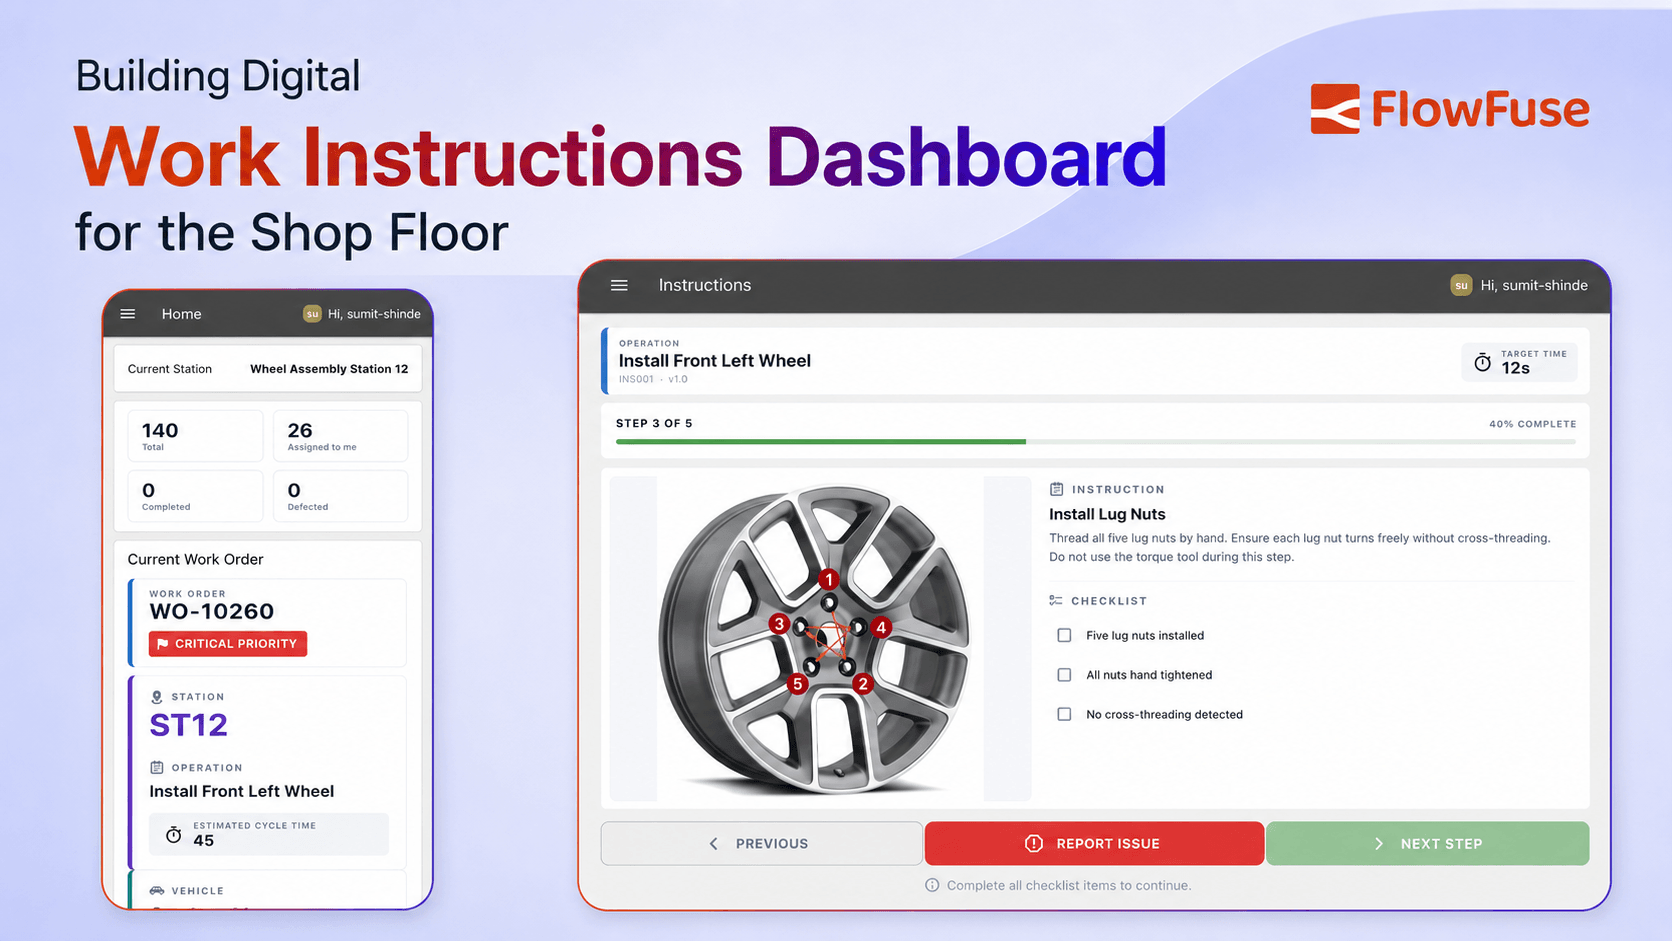
Building Digital Work Instructions Dashboard for the Shop Floor
Learn how to build digital work instructions with FlowFuse: personalized operator apps with guided steps and traceability.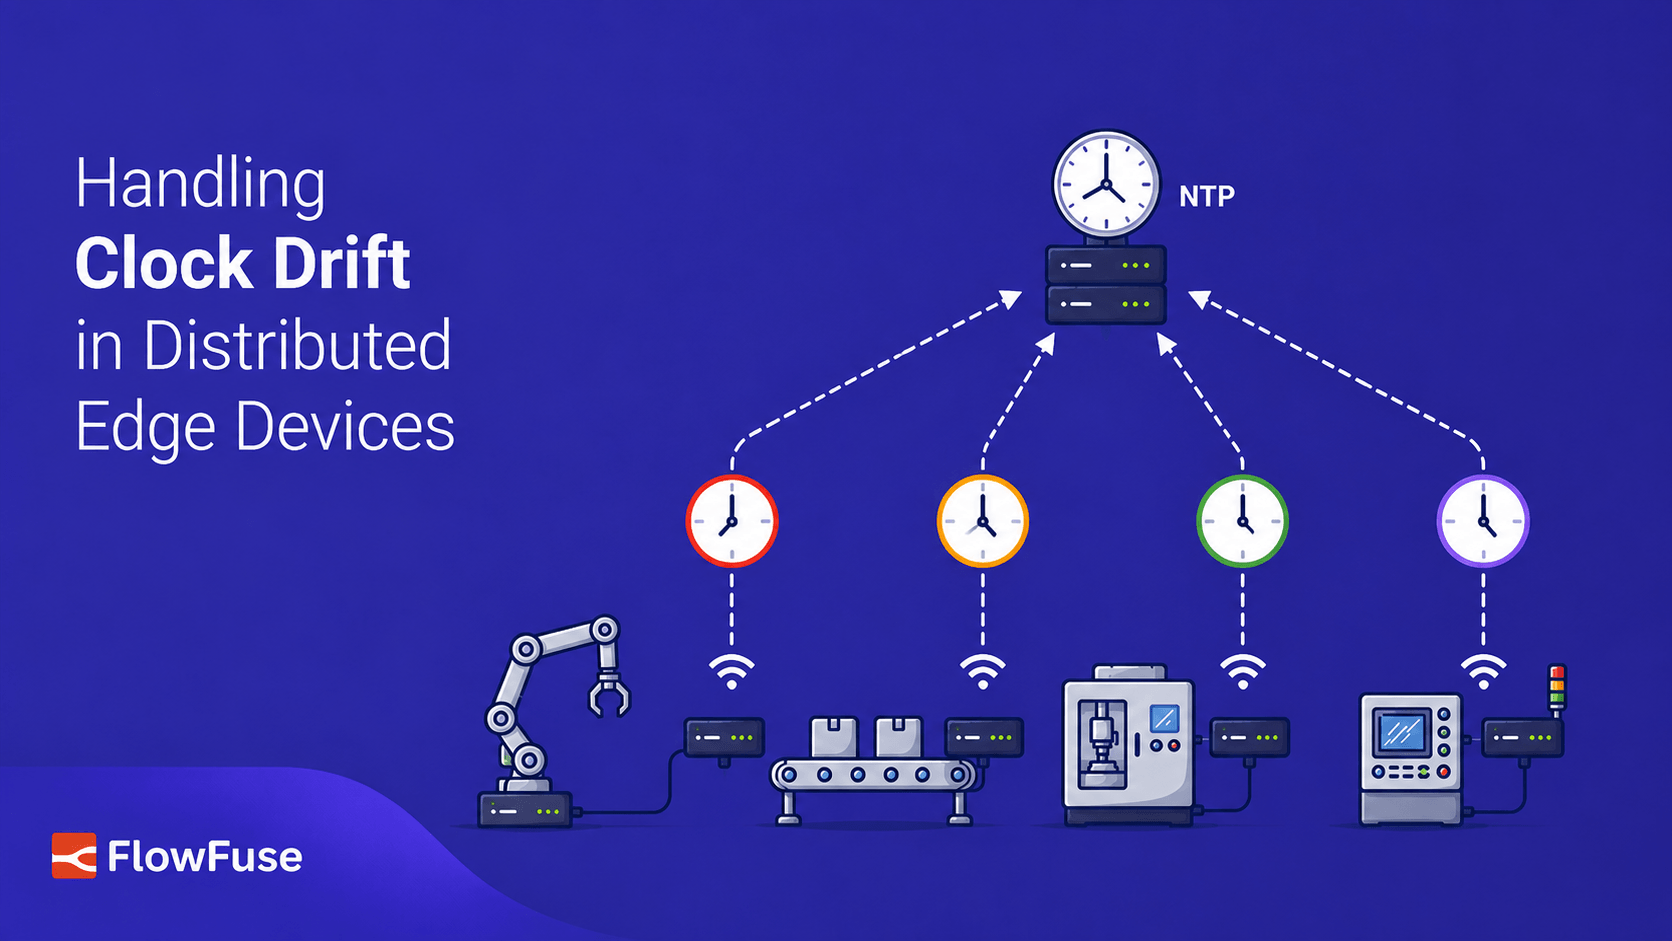
Handling Clock Drift in Distributed Edge Devices
Learn how to prevent clock drift on distributed edge devices using NTP, local time servers, and FlowFuse to ensure accurate timestamps and reliable IIoT data.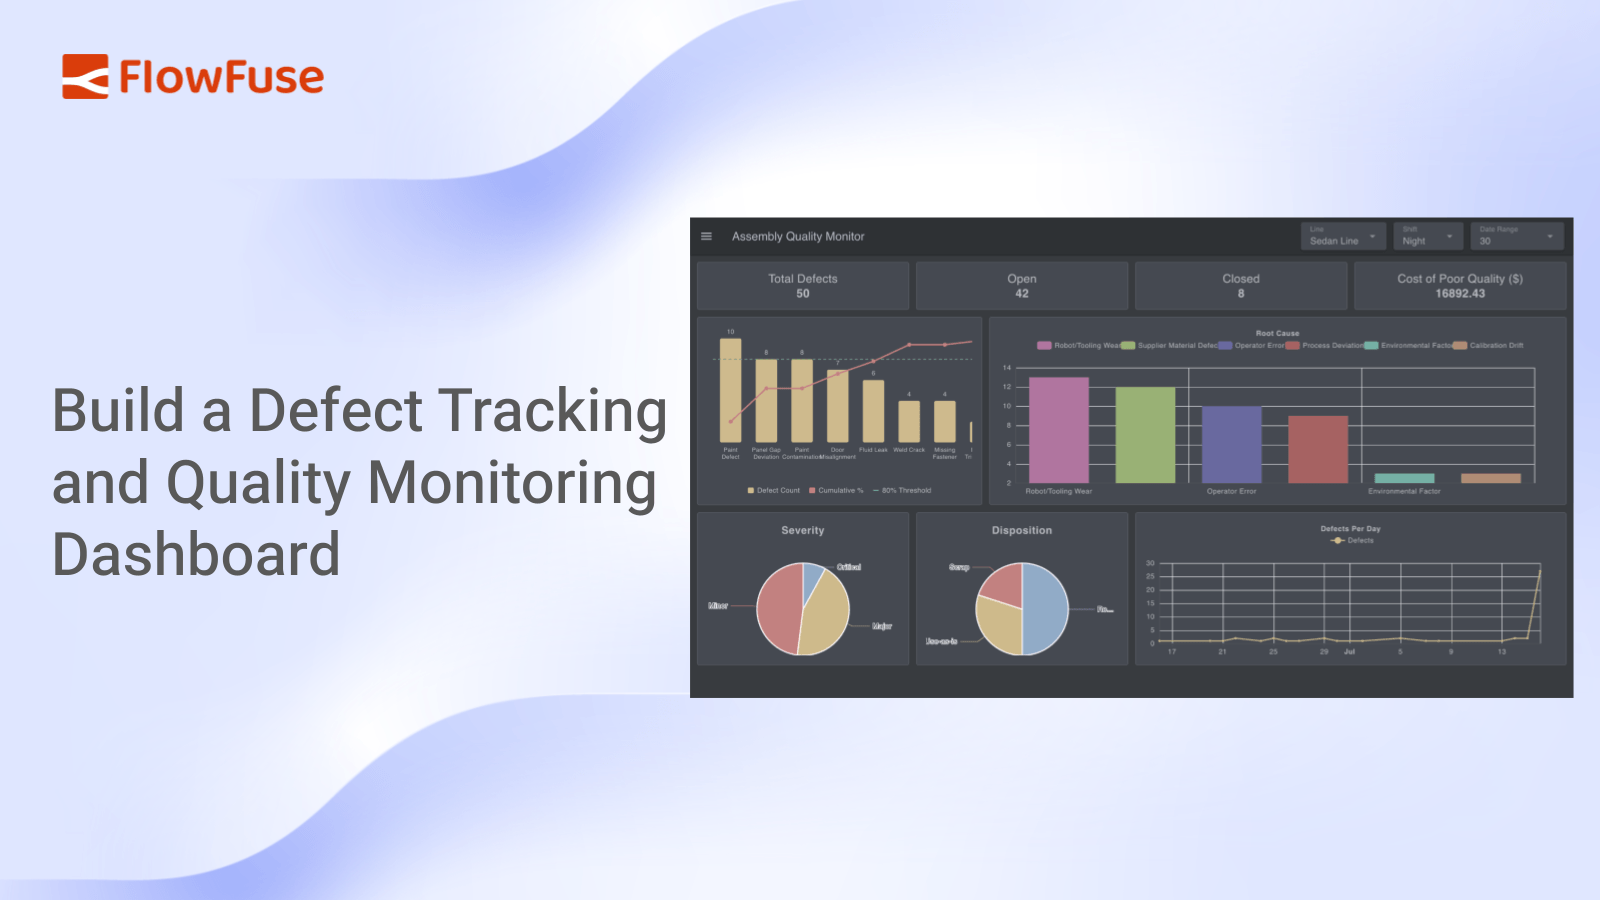
Build a Defect Tracking and Quality Monitoring Dashboard
Build a FlowFuse dashboard that tracks production defects, ranks them with a Pareto chart, and totals cost of poor quality.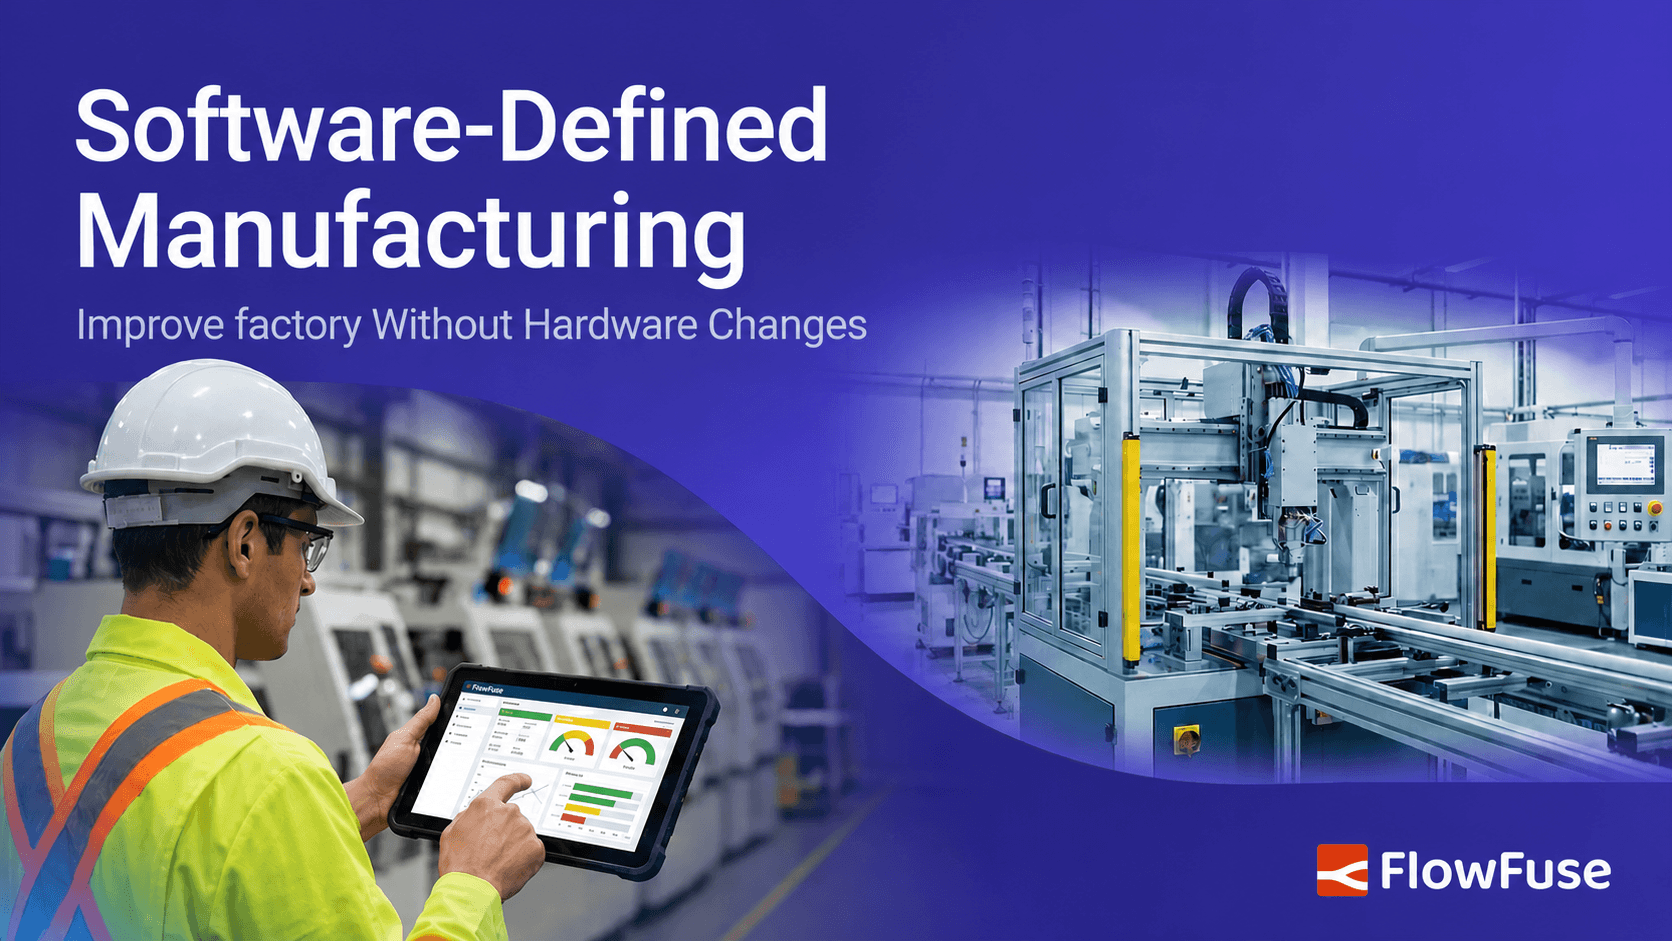
Software-Defined Manufacturing: Improve Without Hardware Changes
Software-defined manufacturing (SDM) is changing how factories improve operations. Learn what it means and how FlowFuse helps.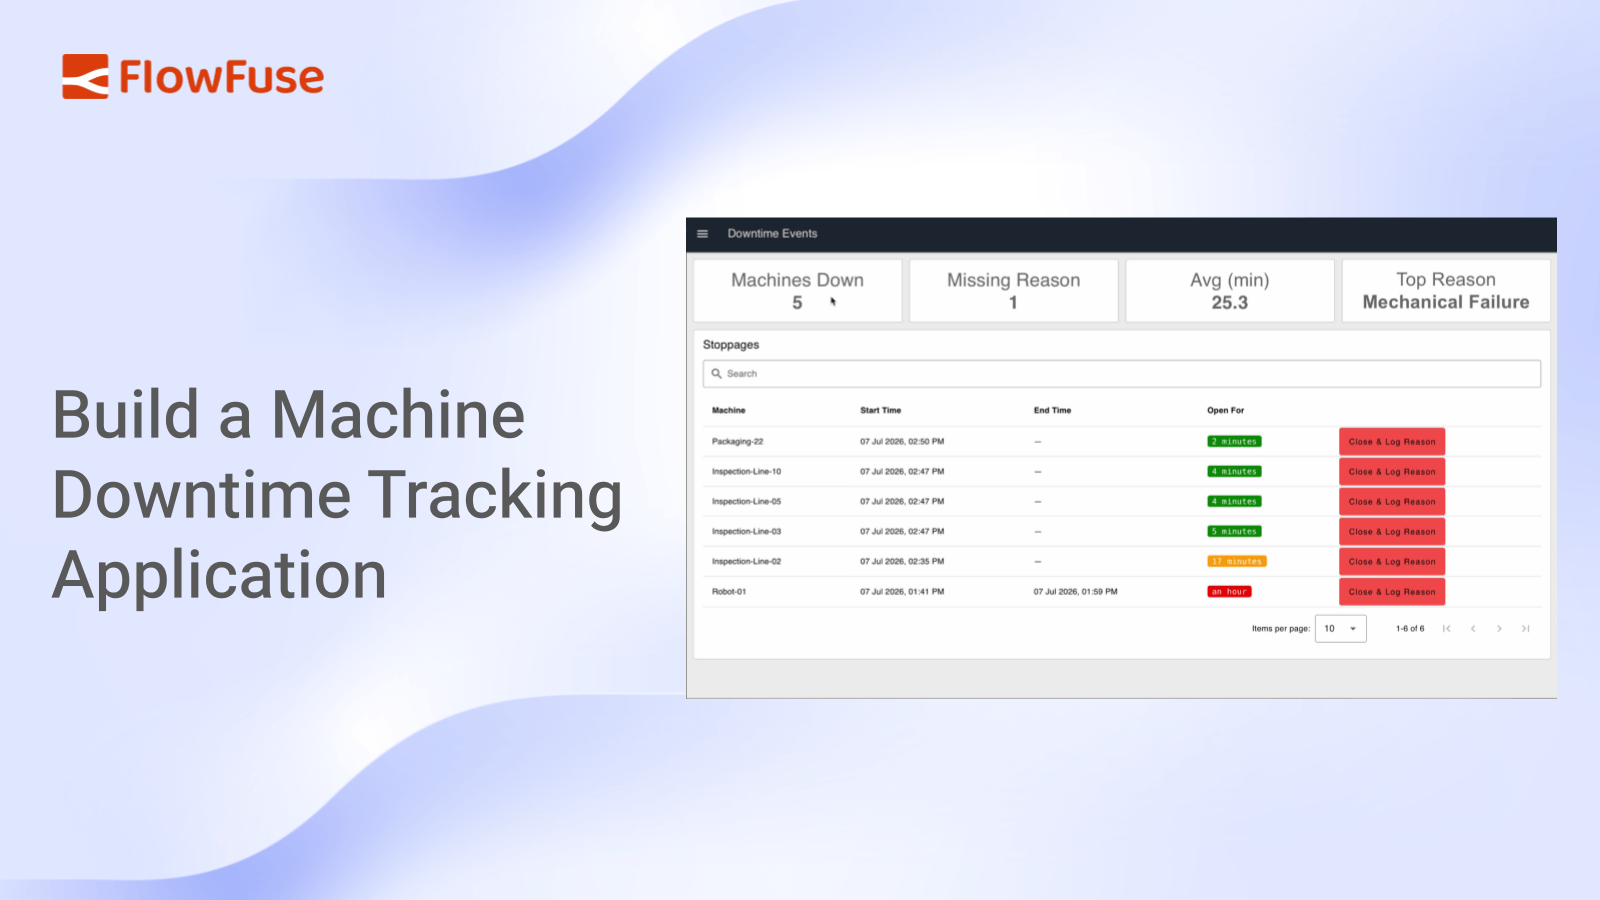
Build a Machine Downtime Tracking Application
Learn how to build a machine downtime tracking application in FlowFuse that captures events over MQTT and shows live KPIs.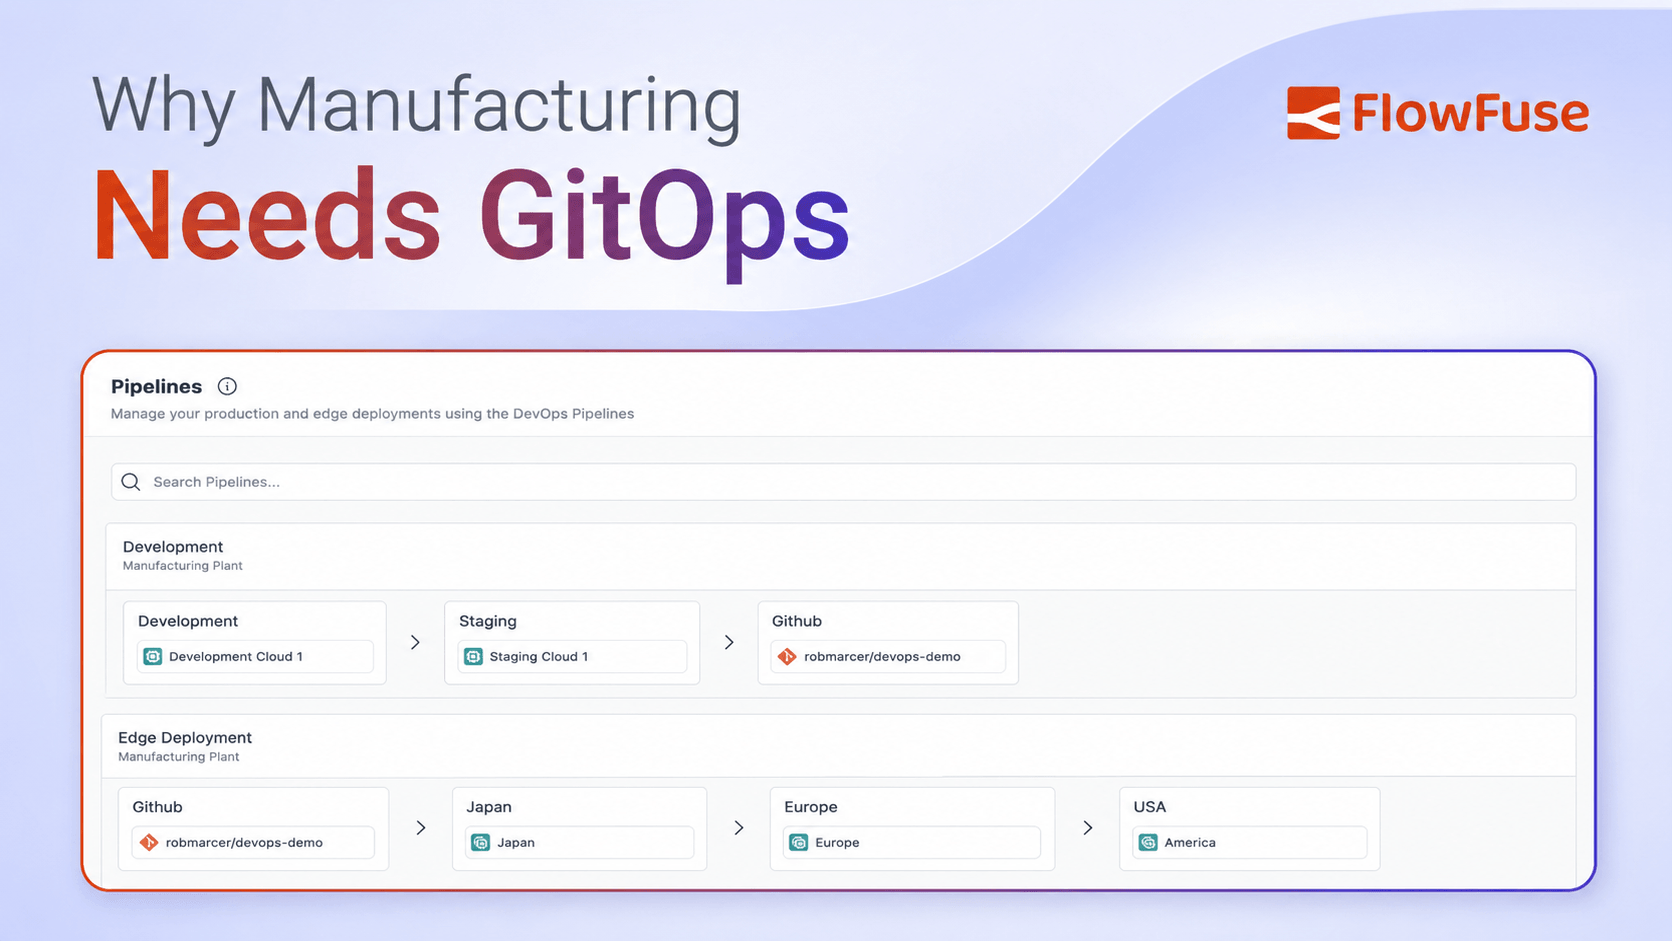
Why Manufacturing Needs GitOps
Manufacturing has always managed change with discipline. Learn how GitOps and FlowFuse Pipelines bring that rigor to software.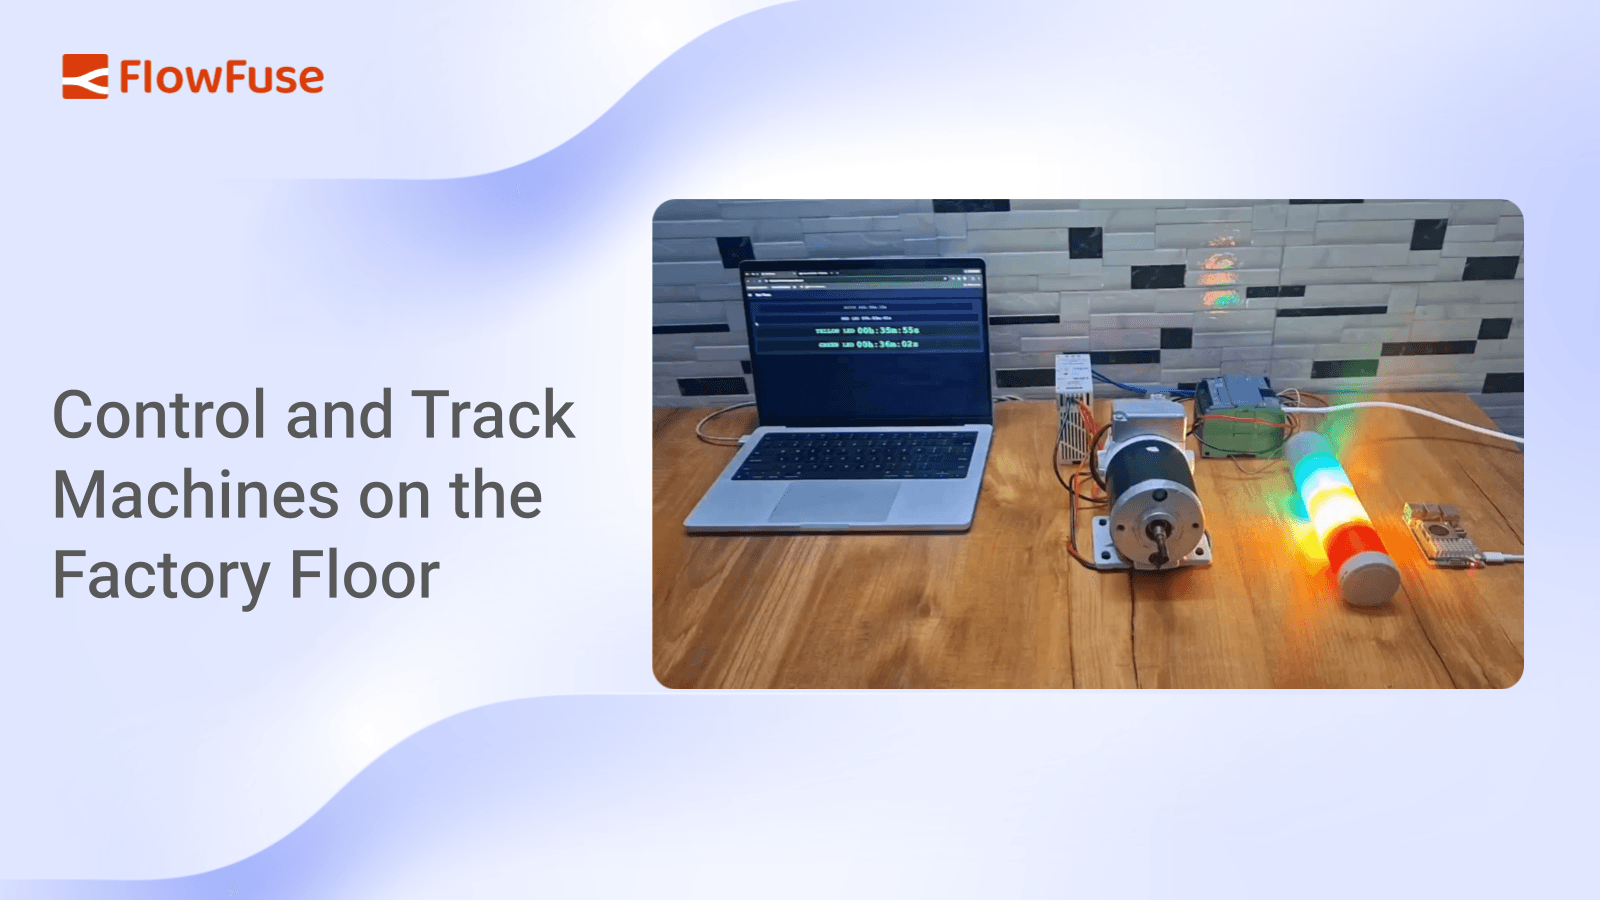
Control and Track Machines on the Factory Floor
Learn how to connect FlowFuse to a Siemens S7 PLC, build an operator dashboard, and automatically track device runtime data.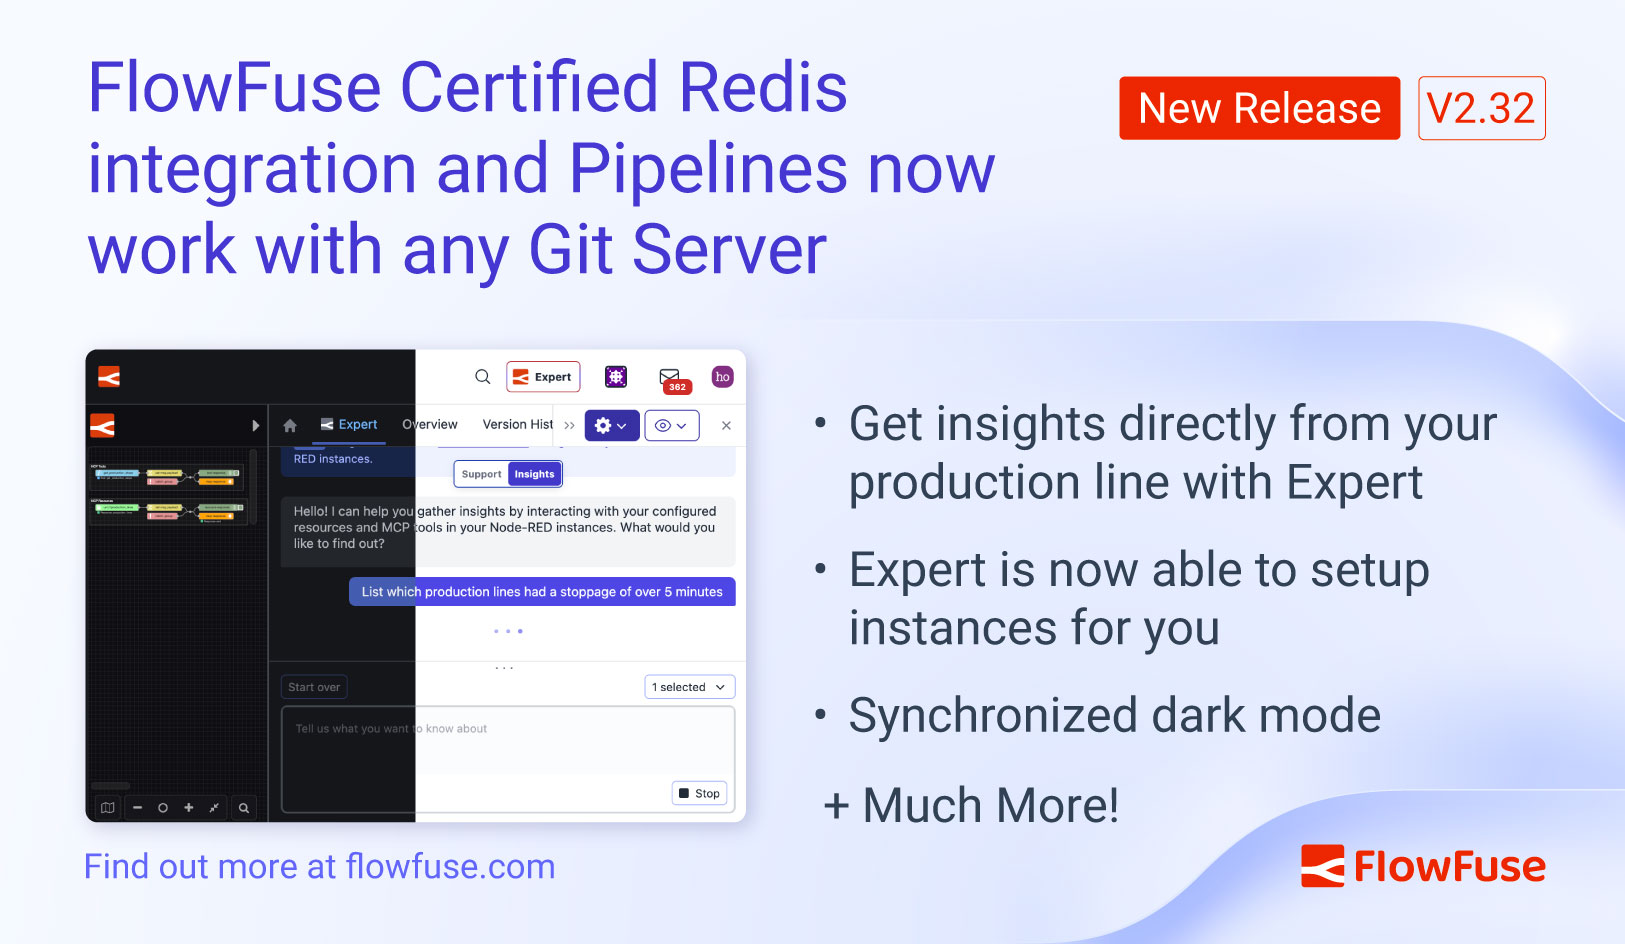
FlowFuse 2.32: Certified Redis, Git Pipelines for Any Server, Insights on Remote Instances, and Dark Mode
FlowFuse 2.32 certifies the Redis node, extends Git pipelines to any HTTPS server, and adds Insights mode and dark theme.
Announcing Node-RED Con 2026: Call for Papers Now Open
Node-RED Con 2026 takes place November 3, 2026, proudly sponsored by FlowFuse. The Call for Papers is open until July 31.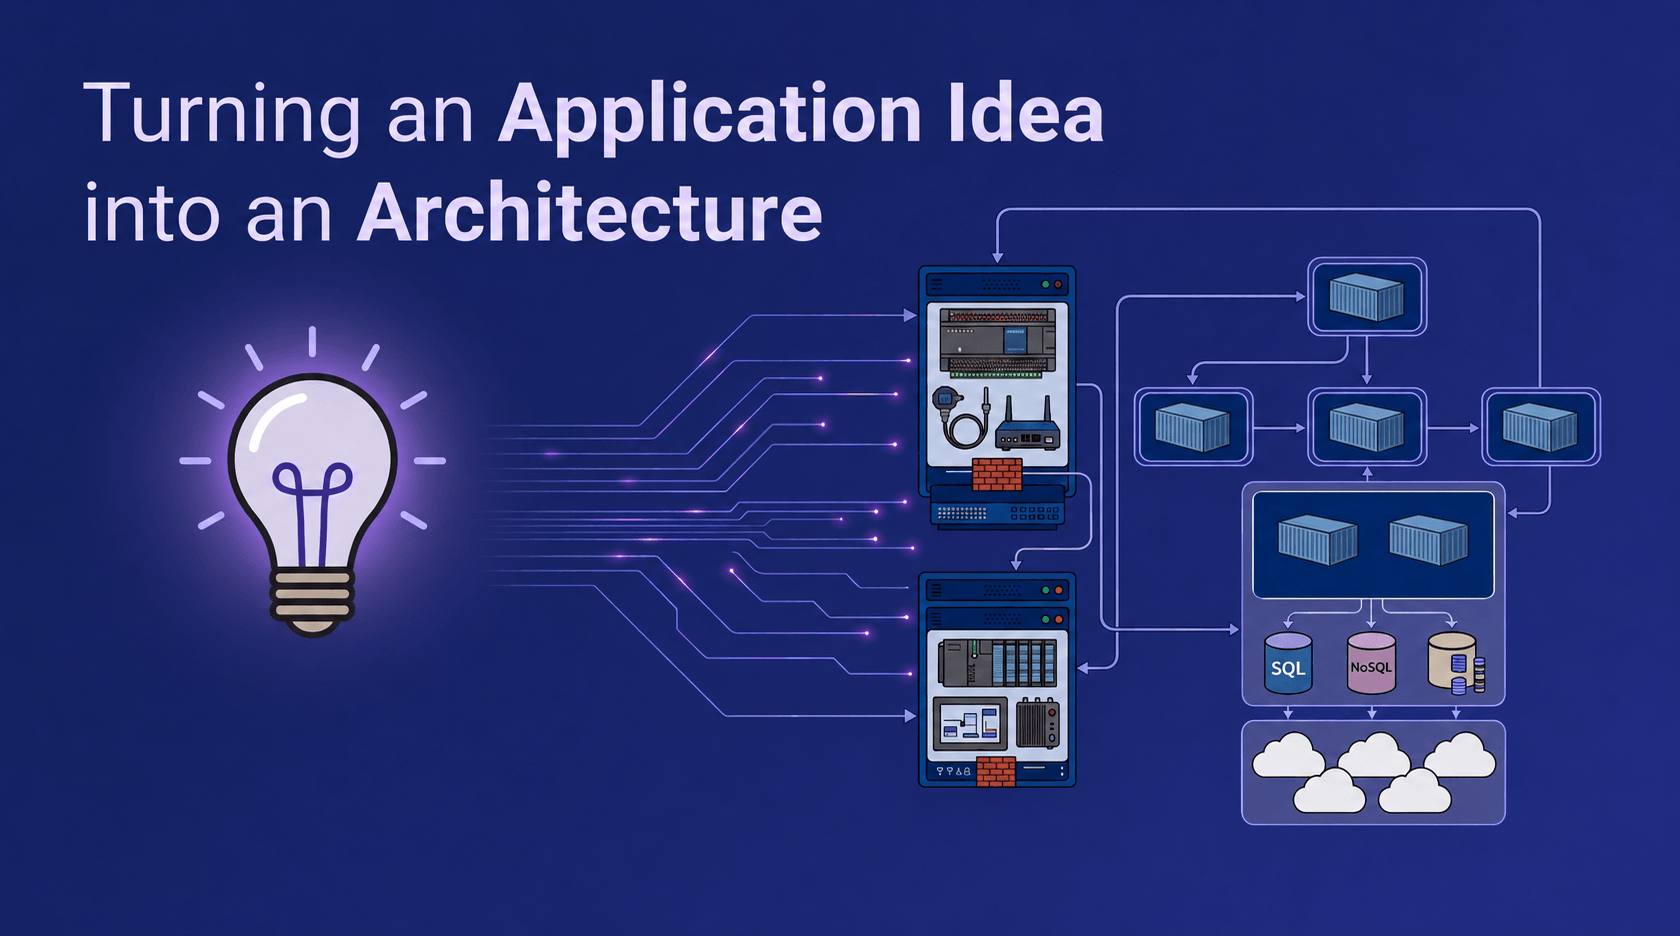
Turning an Application Idea into an Architecture
Learn how to turn industrial application ideas into clear architectures using a structured four-step framework based on FlowFuse building blocks.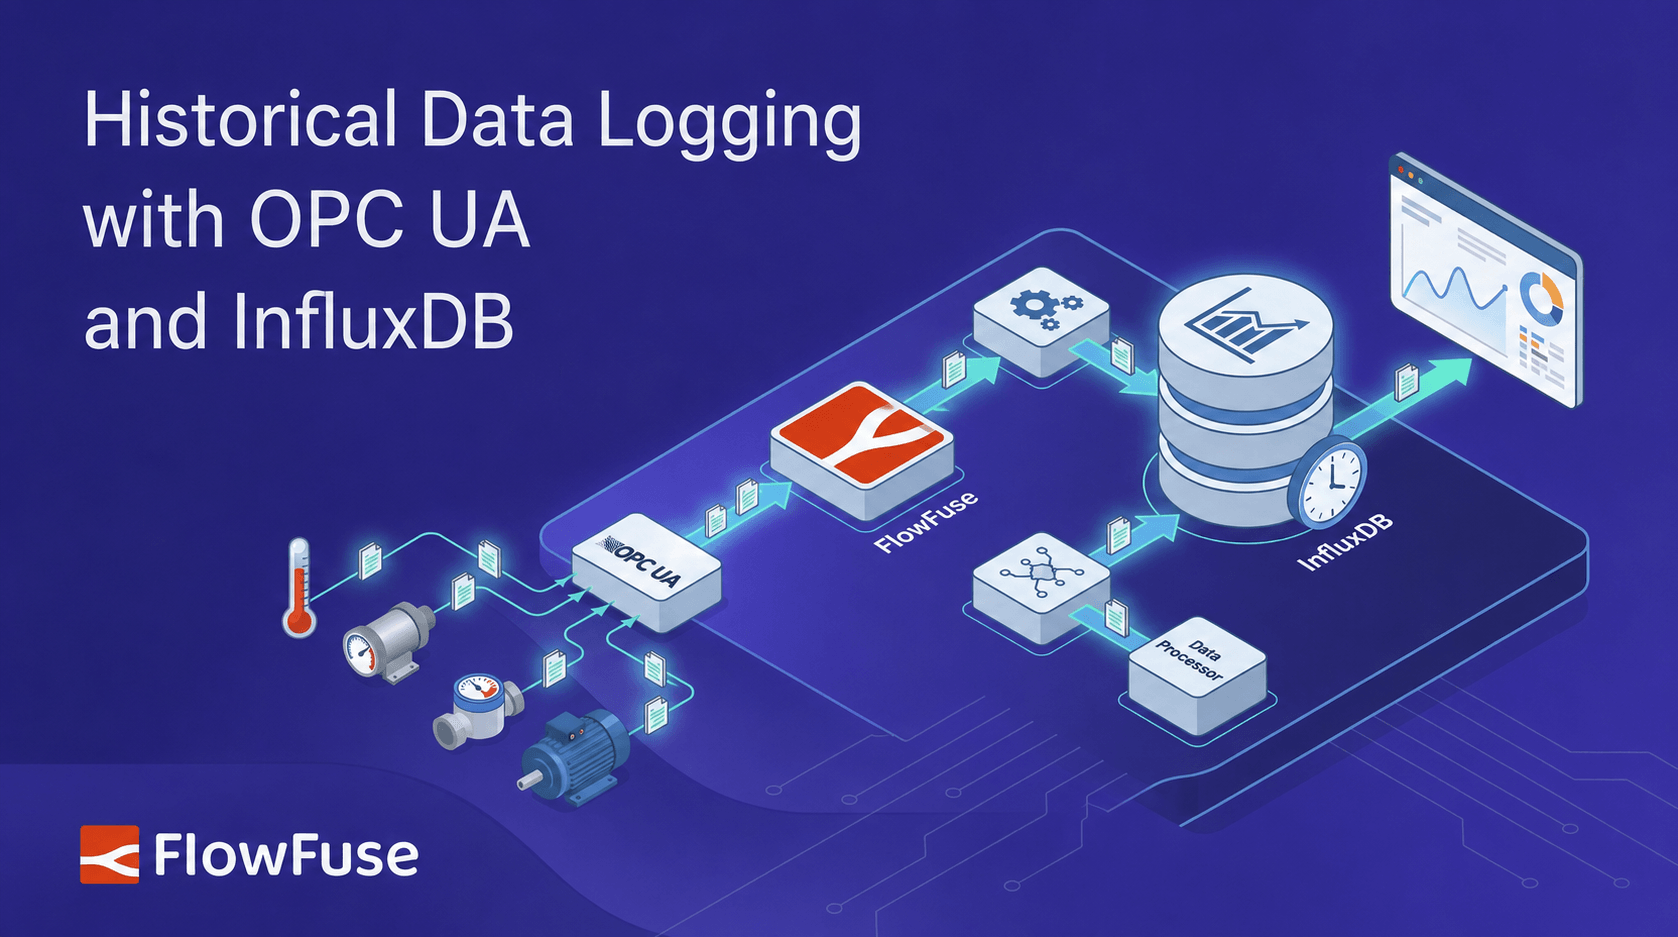
Historical Data Logging with OPC UA and InfluxDB
Learn how to connect OPC UA and InfluxDB in FlowFuse to log equipment data as timestamped history and spot trends early.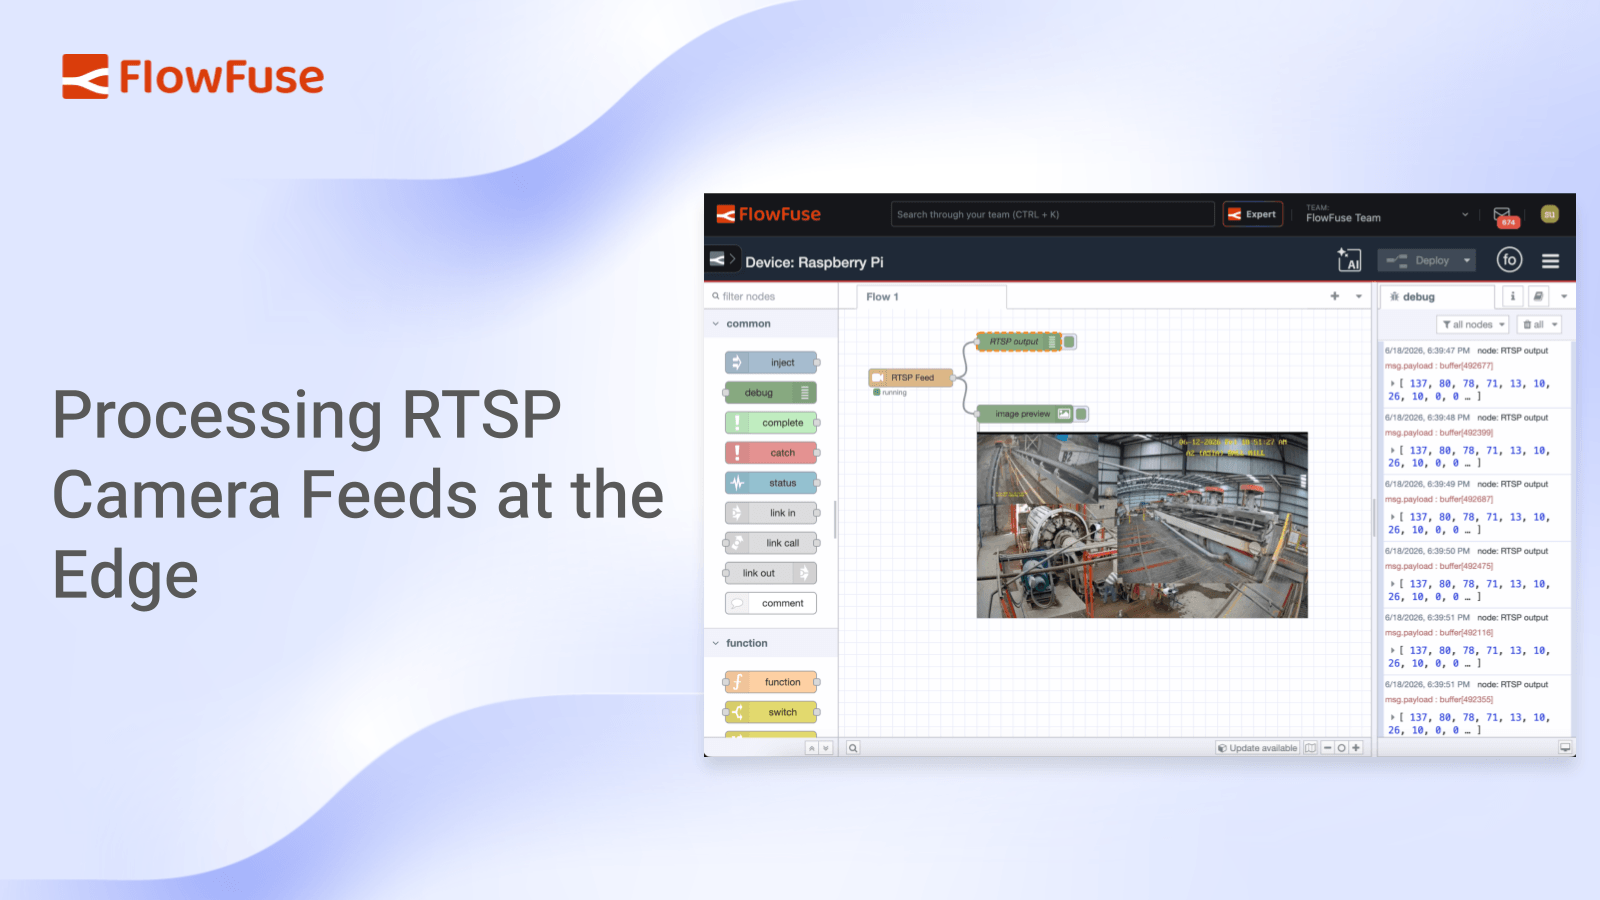
Processing RTSP Camera Feeds at the Edge
Learn how to use the FlowFuse RTSP Video Feed node to pull camera frames onto a dashboard and feed local AI models directly.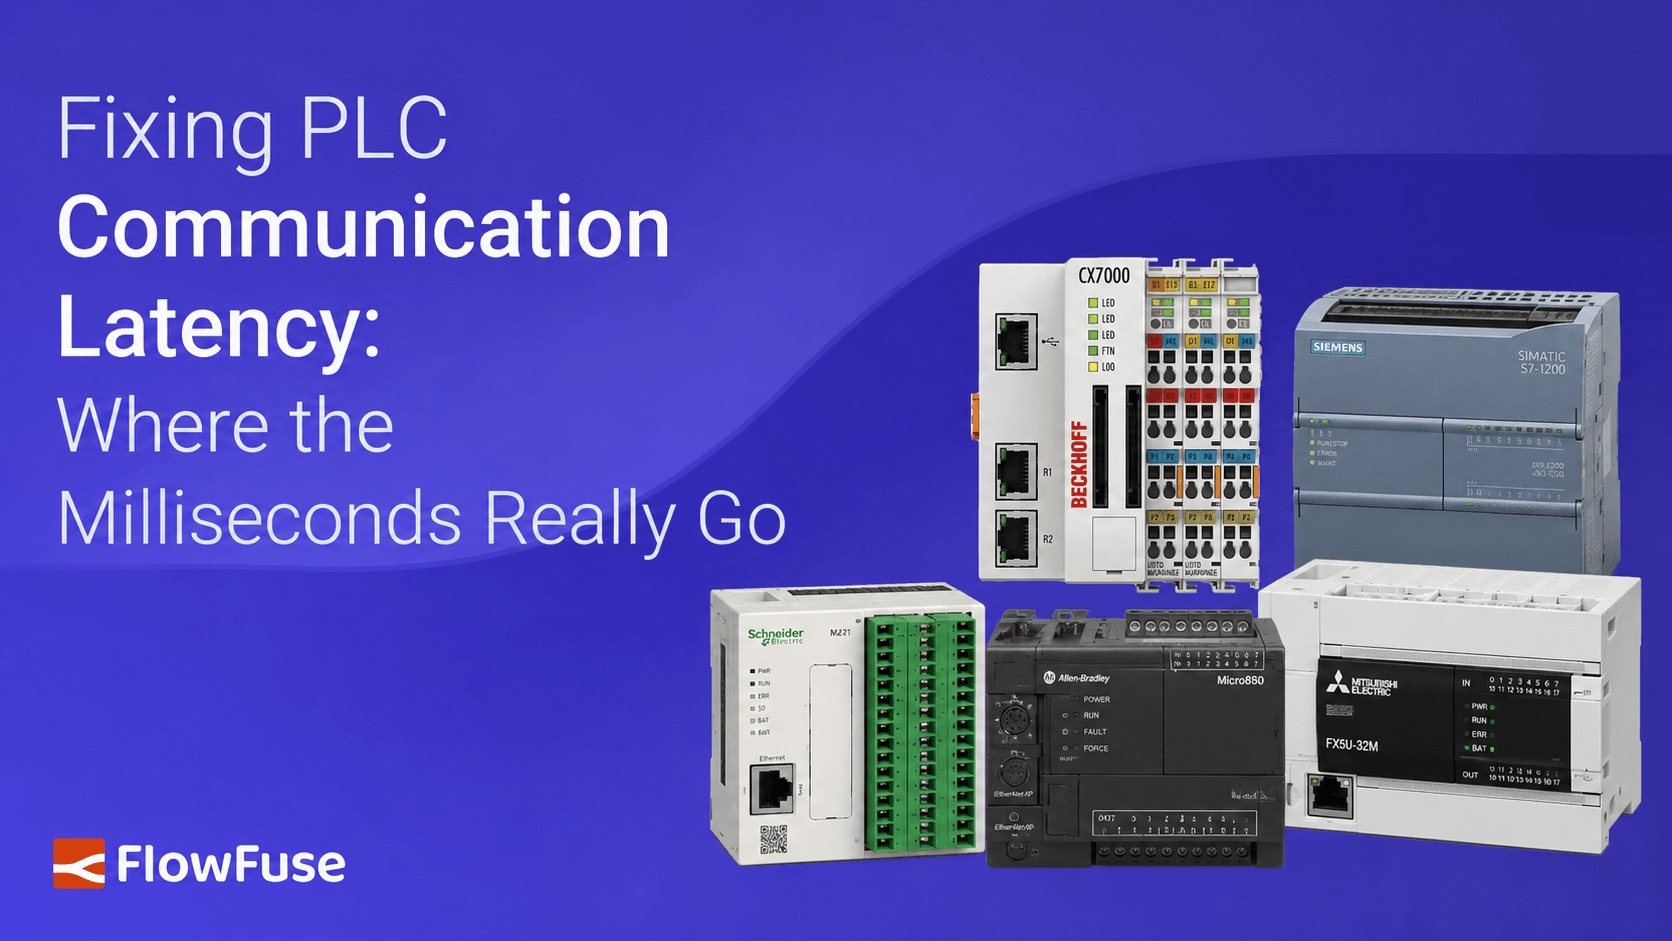
Fixing PLC Communication Latency: Where the Milliseconds Really Go
Troubleshoot PLC communication latency by identifying common causes such as poll rates, timeout settings, connection limits, and protocol selection.